
I was able to help this user create a custom indicator to help him identify quickly if a stock was above or below a moving average. Here was his criteria.
Hey thanks! So I have a rule (or should have) that says only go long if price is above the 200 day SMA, and only short if below. I also like to have 8 charts on 1 screen. I think it would be awesome if the border of each chart would have a thin red or green outline, or any chart I’m scrolling through. That would help me stay more disciplined on that rule. Would also be great to have an option to use other timeframed moving averages (The one by ike in tradingview is good to work off) like the 5 and 150 day EMAs because the 200 might be a little too strict. Thoughts?
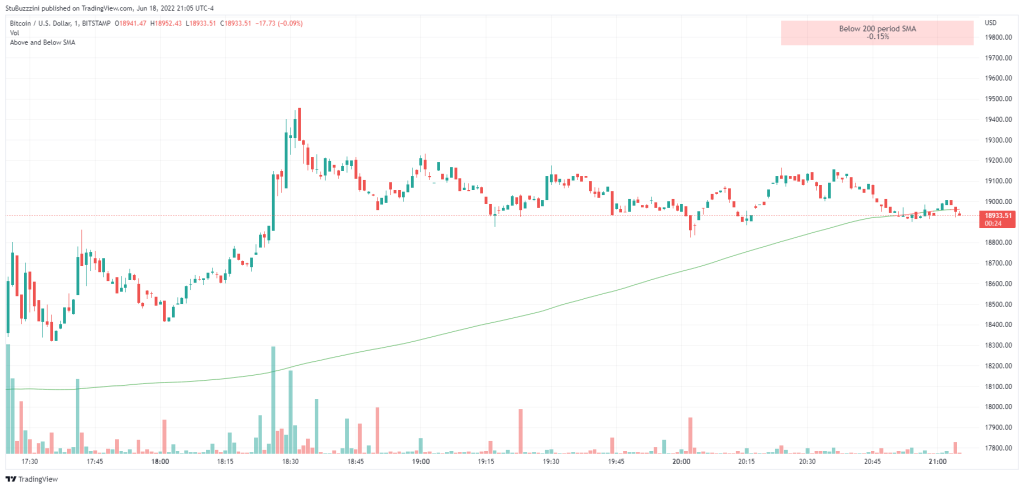
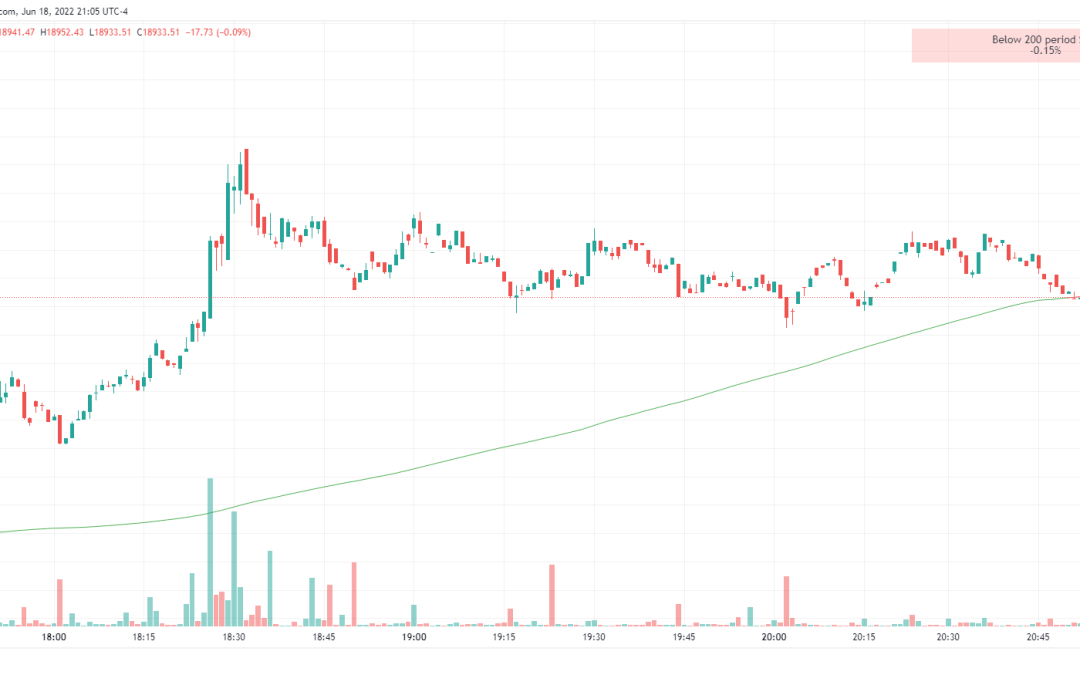
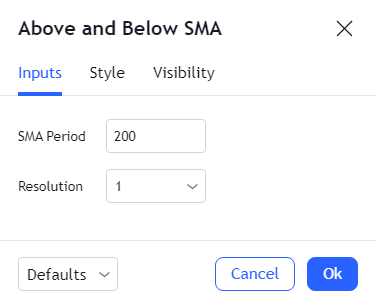
I created the script for the OP and it displays a table in the top right that shades green/red depending on whether the close is above or below the moving average. It shows how far above or below the close is. This allowed the OP to open up 8 charts at once and easily see which charts were above the moving average and which ones were below. Another user asked to make it so the moving average could be pegged to the daily chart so it doesnt change when you change the chart period. I updated the chart to make it user adjustable.
Here is the link to the final script.
https://www.tradingview.com/script/UWjw1jc3-Above-and-Below-SMA/